


1 Introduction
In this report we assess the extent to which the Resource Management Act (RMA) and other environmental regulations have contributed to house price inflation in Aotearoa. To do this, we review the factors of housing price growth (HPG) in New Zealand and provide a simple description of the available data and existing research on the topic. In this chapter, we briefly explain our methodology for the literature review and then present the relevant descriptive statistics for the factors of HPG. Then we have two separate chapters on factors of supply and factors of demand. In each of the chapters we provide different sections on the literature review of the topics of interest. In the last section, we discuss the limitations of the literature and potential future studies required for improving our understanding of the factors of HPG in New Zealand. For the analyses of the factors of HPG, given this project’s short timeframe, we have set limits on the scope of the data analysis. Where information is available, we use the existing work and provide a description of the findings.
1.1 Methodology of literature review
For a systematic review of the literature, we followed a four-step process for finding relevant studies:
Define the topic of interest: For a correct understanding of the drivers of house price growth, we need to have a review of the impact of environmental regulations and all other relevant factors.
Undertake a systematic review of the relevant research literature to the topics of interest. Each factor of demand and supply will be defined as a topic of interest and looked for in the literature in a separate section of our report.
Use independent research search engines and databases, e.g. Econlit, SAGE, SCOPUS, Proquest, Ebsco, Google Scholar, and a general google search for finding the grey literature
Contact relevant New Zealand organisations and authors of relevant research topics to learn about other (unpublished) available sources
After finding the relevant studies, we assess each chosen topic against the IPCC’s uncertainty framework (IPCC, 2010). To do this, we highlight the methodological quality of the studies (research design). We prioritise using the highest quality well implemented research designs in our review.3 The output of IPCC’s uncertainty framework is illustrated in Figure 1.
Figure 1 IPCC’s uncertainty framework

Source: IPCC, 2010.
Based on this framework, we rank the agreement, evidence and confidence we have with the results from the literature in a diagram at the beginning of each section. We clarify the hypothesis that the diagram is referring to. ‘Agreement’ shows the level of compliance across the studies on the stated hypothesis. ‘Evidence’ shows the availability and quality of the data and methodology available in the literature on the specific hypothesis. ‘Confidence’ is the combination of agreement, evidence and our evaluation of the credibility of the findings from the literature. The scoring scale used has the following characteristics:
the scale has a range from one to three,
three is the highest score on the scale and one is the lowest,
a score of one would reflect no agreement, no evidence and minimum confidence.
Figure 2 Example of the uncertainty assessment diagram

1.1.0.0.1 Source: Principal Economics.
The topics of interest in this analysis regarding impacts on factors of supply include:
Impacts of (non-environmental) regulations
Impact of environmental regulations
Availability of infrastructure
Supply chains and construction costs
On the demand side factors we include:
Affordability
Monetary policy and mortgage rates
Population and migration
Availability of finance
Household size
Tax policy, housing subsidies and other interventions
In our search for relevant literature, we used a range of keywords to find the available studies from different search engines. Appendix A provides a list of our keywords and the list of the studies that we used by the topic of interest.
1.2 Description of HPG and its factors
HPG has been discussed amongst politicians and academics extensively. Different solutions to housing crises have been proposed over the last decades. The solutions target factors of demand and supply and include increases in deposit ratios, a foreign buyer ban, decreases in zoning regulation, capital gains tax, RM reform amongst the others. The first step to finding a solution is to define the HPG issue correctly and identify its sources. Because of the inter-related impact of the supply and demand factors, one cannot look just at housing supply, or housing demand to judge its impact on housing outcomes. All these aspects must be considered together.4
This section provides a description of the HPG and the related factors using a range of publicly available data. The purpose of this section is to provide some background and motivate the topics of the studies that we review in the next sections. We provide the findings from our review and any causal inference about the impact of different factors of HPG in the next sections. We intend to provide a description of the HPG over the last fifty years for the 1971-2021 period. When data is not available, we illustrate and describe the data for the longest timeframe available.
New Zealand experienced a significant HPG over the last fifty years
Figure 3 shows the nominal changes in housing prices using a house price index over the 1971-2020 period.5 Nominal house prices are 82.5 times (8251 percent) higher in 2020 than in 1971 (and 342 percent higher in 2020 than in 2001).6 In contrast, over this period, nominal rental prices have grown by around 18.3 times7 and the cost of consumer goods and services has increased 15.7 times based on the CPI.8 The grey shaded areas show a range of major worldwide crises. For most of these crises, the HPG has been small or zero. However, during the Covid-19 pandemic, there has been a significant increase in (nominal) house prices by 34 percent from Jan 2020 – Jun 2021. We describe changes in other factors during these crises in the next figures.
The difference between CPI and the house price index indicates that house price inflation has increased significantly faster than other goods and services. For the balance of this report, we deflate house prices (against the CPI) and present real house price growth in the following paragraphs.
Figure 3 Nominal changes in housing prices

Source: Bank for International Settlements, OECD, Statistics NZ, Principal Economics analysis.
Note: We source seasonally adjusted real property price index from The Bank of International Settlements and adjust to nominal prices using the Statistics NZ CPI, seasonally adjusted rental price index from the OECD and the Statistics NZ CPI. All data is then rebased to 1971 = 100. We highlight notable recessionary periods in New Zealand identified by Reddell et al., (2008). These include the First Oil Price Shock (1974 – 1977), The Second Oil Price Shock (1979 – 1982), The 91 – 92 Recession, (attributable to the 1987 share market crash, subsequent monetary responses and impacts of the first Gulf War - 1991 – 1992), The Asian Crisis and drought (1997 – 1999), we add COVID-19 as an additional recessionary period (2020-).
Over the last fifty years, house prices have grown four times faster than other consumer goods and services
Figure 4 shows the (real) house price growth on the left (vertical) axis and the percentage annual change in residential mortgage floating rate and Official Cash Rate (OCR) on the right axis. The compound average growth rate (CAGR) in house prices over the last fifty years was 3.12 percent and house prices have grown by 364 percent in real terms over this period. This suggests that house prices have grown almost four times faster than other consumer goods and services. The CAGR over the last twenty years (between 2001 and 2020) is 5.23 percent and the real HPG is 176.9 percent. OCR and mortgage rates have decrease significantly over the Covid-19 pandemic period by 0.75 percent.
As will be discussed in the literature review sections, one commonly cited reason for HPG are the low interest rates that have ensued since 1991, enabling greater serviceability of mortgages and higher borrowing potential. As shown in Figure 4, over the 1971-2021 period, mortgage floating rates have been extremely volatile with a minimum of 4.51 percent in December 2020 and a maximum of 20.5 percent in June 1987.
Figure 4 House price growth and residential floating mortgage interest rates

Source: Bank of International Settlements, RBNZ (years 2004 – 2021), Te Ara (years 1966 – 2008), Stroombergen, (2010), Principal Economics analysis.
Note: We source historic variable first-mortgage housing rate (1966 – 2008) from Stroombergen, (2010) and append the residential mortgage floating interest rates from RBNZ, opting for RBNZ data for overlapping years. Similarly, the OCR has been sourced from the RBNZ. We discuss the source and adjustments to made for real house price s.a. series earlier this report in Figure 7. We rebase the real property price index sourced from The Bank of International Settlements to 1971. We highlight notable recessionary periods in New Zealand identified by Reddell et al., (2008). These include the First Oil Price Shock (1974 – 1977), The Second Oil Price Shock (1979 – 1982), The 91 – 92 Recession, (attributable to the 1987 share market crash, subsequent monetary responses and impacts of the first Gulf War - 1991 – 1992), The Asian Crisis and drought (1997 – 1999), we add COVID-19 as an additional recessionary period (2020-).
New Zealand HPG has been the highest during the Covid-19 pandemic
Figure 5 illustrates the changes in real house prices for New Zealand and other countries. Over the 1971-2021 period, the HPG in New Zealand has been the second highest, with slightly slower growth than the UK. The response of different housing markets to crises has been different. For example, the GFC led to significant price decreases in the US and the UK, with smaller increases in New Zealand and Germany, and raised house prices in Australia and Canada. This partly reflects the impact of local monetary policy and the availability of finance to appropriately respond to a short-term economic crisis. During the Covid-19 pandemic, most countries have experienced increases in house prices, partly due to lower mortgage rates. During this period, New Zealand has the highest HPG amongst the listed countries, which may indicate the impact of lower mortgage rates combined with the shortage of housing evident from the already increasing house price trend before the Covid-19 period.
Figure 5 International changes in real house price

Source: Bank for International Settlements
Note: We source seasonally adjusted real property price index from The Bank of International Settlements. All data is rebased to 1971 = 100. We highlight notable recessionary periods in New Zealand identified by Reddell et al., (2008). These include the First Oil Price Shock (1974 – 1977), The Second Oil Price Shock (1979 – 1982), The 91 – 92 Recession, (attributable to the 1987 share market crash, subsequent monetary responses and impacts of the first Gulf War - 1991 – 1992), The Asian Crisis and drought (1997 – 1999), we add COVID-19 as an additional recessionary period (2020-).
Over the last decade, the cost of housing consumption has increased more significantly for renters
Figure 6 shows how real housing costs for renters and owners since 2007. Total mortgage payments have increased slower than the rent payments. The principal payments have increased more significantly than rents. his is driven by increased house prices. The mortgage interest rates have decreased as a result of progressively lower interest rates. The higher increase in cost of renting compared to homeownership has potentially led to increased demand and higher HPG over the last decade.
Figure 6 Real housing cost indices

Source: Statistics NZ, Principal Economics analysis.
Note: We source household expenditures on housing from the Statis NZ Household Economic Survey and construct an index for each expenditure type. This is then deflated by the CPI to determine the real housing cost price indices shown in the figure. We highlight notable recessionary periods in New Zealand identified by Reddell et al., (2008). These include the First Oil Price Shock (1974 – 1977), The Second Oil Price Shock (1979 – 1982), The 91 – 92 Recession, (attributable to the 1987 share market crash, subsequent monetary responses and impacts of the first Gulf War - 1991 – 1992), The Asian Crisis and drought (1997 – 1999), we add COVID-19 as an additional recessionary period (2020-).
The cost of housing consumption, however, has not increased nearly as high as house prices
Figure 7 illustrates the seasonally adjusted (s.a.) residential rental price over the 1971(Q1)-2020(Q4) period. The 19.4 percent rise in real rental prices suggests that the cost of housing consumption has grown faster compared to other consumers good and services over the last fifty years. The rate of real rental prices growth (19.4 percent) is, however, significantly lower than that of real house prices (364 percent). The relatively high HPG compared to growth in cost of renting may be an indicator for high speculation incentives. The “Bright-Line” test is a tax instrument for addressing potential speculative behaviour. We discuss the potential impact of the tax policy and “Bright-Line” test in section 3.6.
Figure 7 Residential rental prices

Source: Bank for International Settlements, OECD, Statistics NZ, Principal Economics 2021 analysis.
Note: We source s.a. real property price index from The Bank of International Settlements, s.a. rental price index from the OECD and Statistics NZ CPI. We rebased all indices to 1971, deflate s.a. rental price index using the CPI and calculate the quarterly year-on-year change for relevant series shown in Figure 7. We highlight notable recessionary periods in New Zealand identified by Reddell et al., (2008). These include the First Oil Price Shock (1974 – 1977), The Second Oil Price Shock (1979 – 1982), The 91 – 92 Recession, (attributable to the 1987 share market crash, subsequent monetary responses and impacts of the first Gulf War - 1991 – 1992), The Asian Crisis and drought (1997 – 1999), we add COVID-19 as an additional recessionary period (2020-).
Regions with increased employment opportunities have experienced higher HPG
As shown in the left hand side in Figure 8, between 1992 and 2020,employment density across New Zealand regions grew with significant higher densities in large urban areas, more than doubling in the regions of Auckland (211 percent) and Bay of Plenty (209 percent).These regions have also experienced some of the highest growth in real house prices over the same period with 293 and 268 percent house price growth, respectively – as shown on the right map. The high house price growth associated with high employment opportunities may be an indication of the positive association between international (and local) migration and HPG. While there is a positive correlation between HPG and the growth in employment density, the ratio of the two growth series varies significantly across regions, which suggests the importance of the impact of other related factors on HPG. We review the impact of population growth on HPG in section 3.3.
Figure 8 Growth in employment density and real house prices
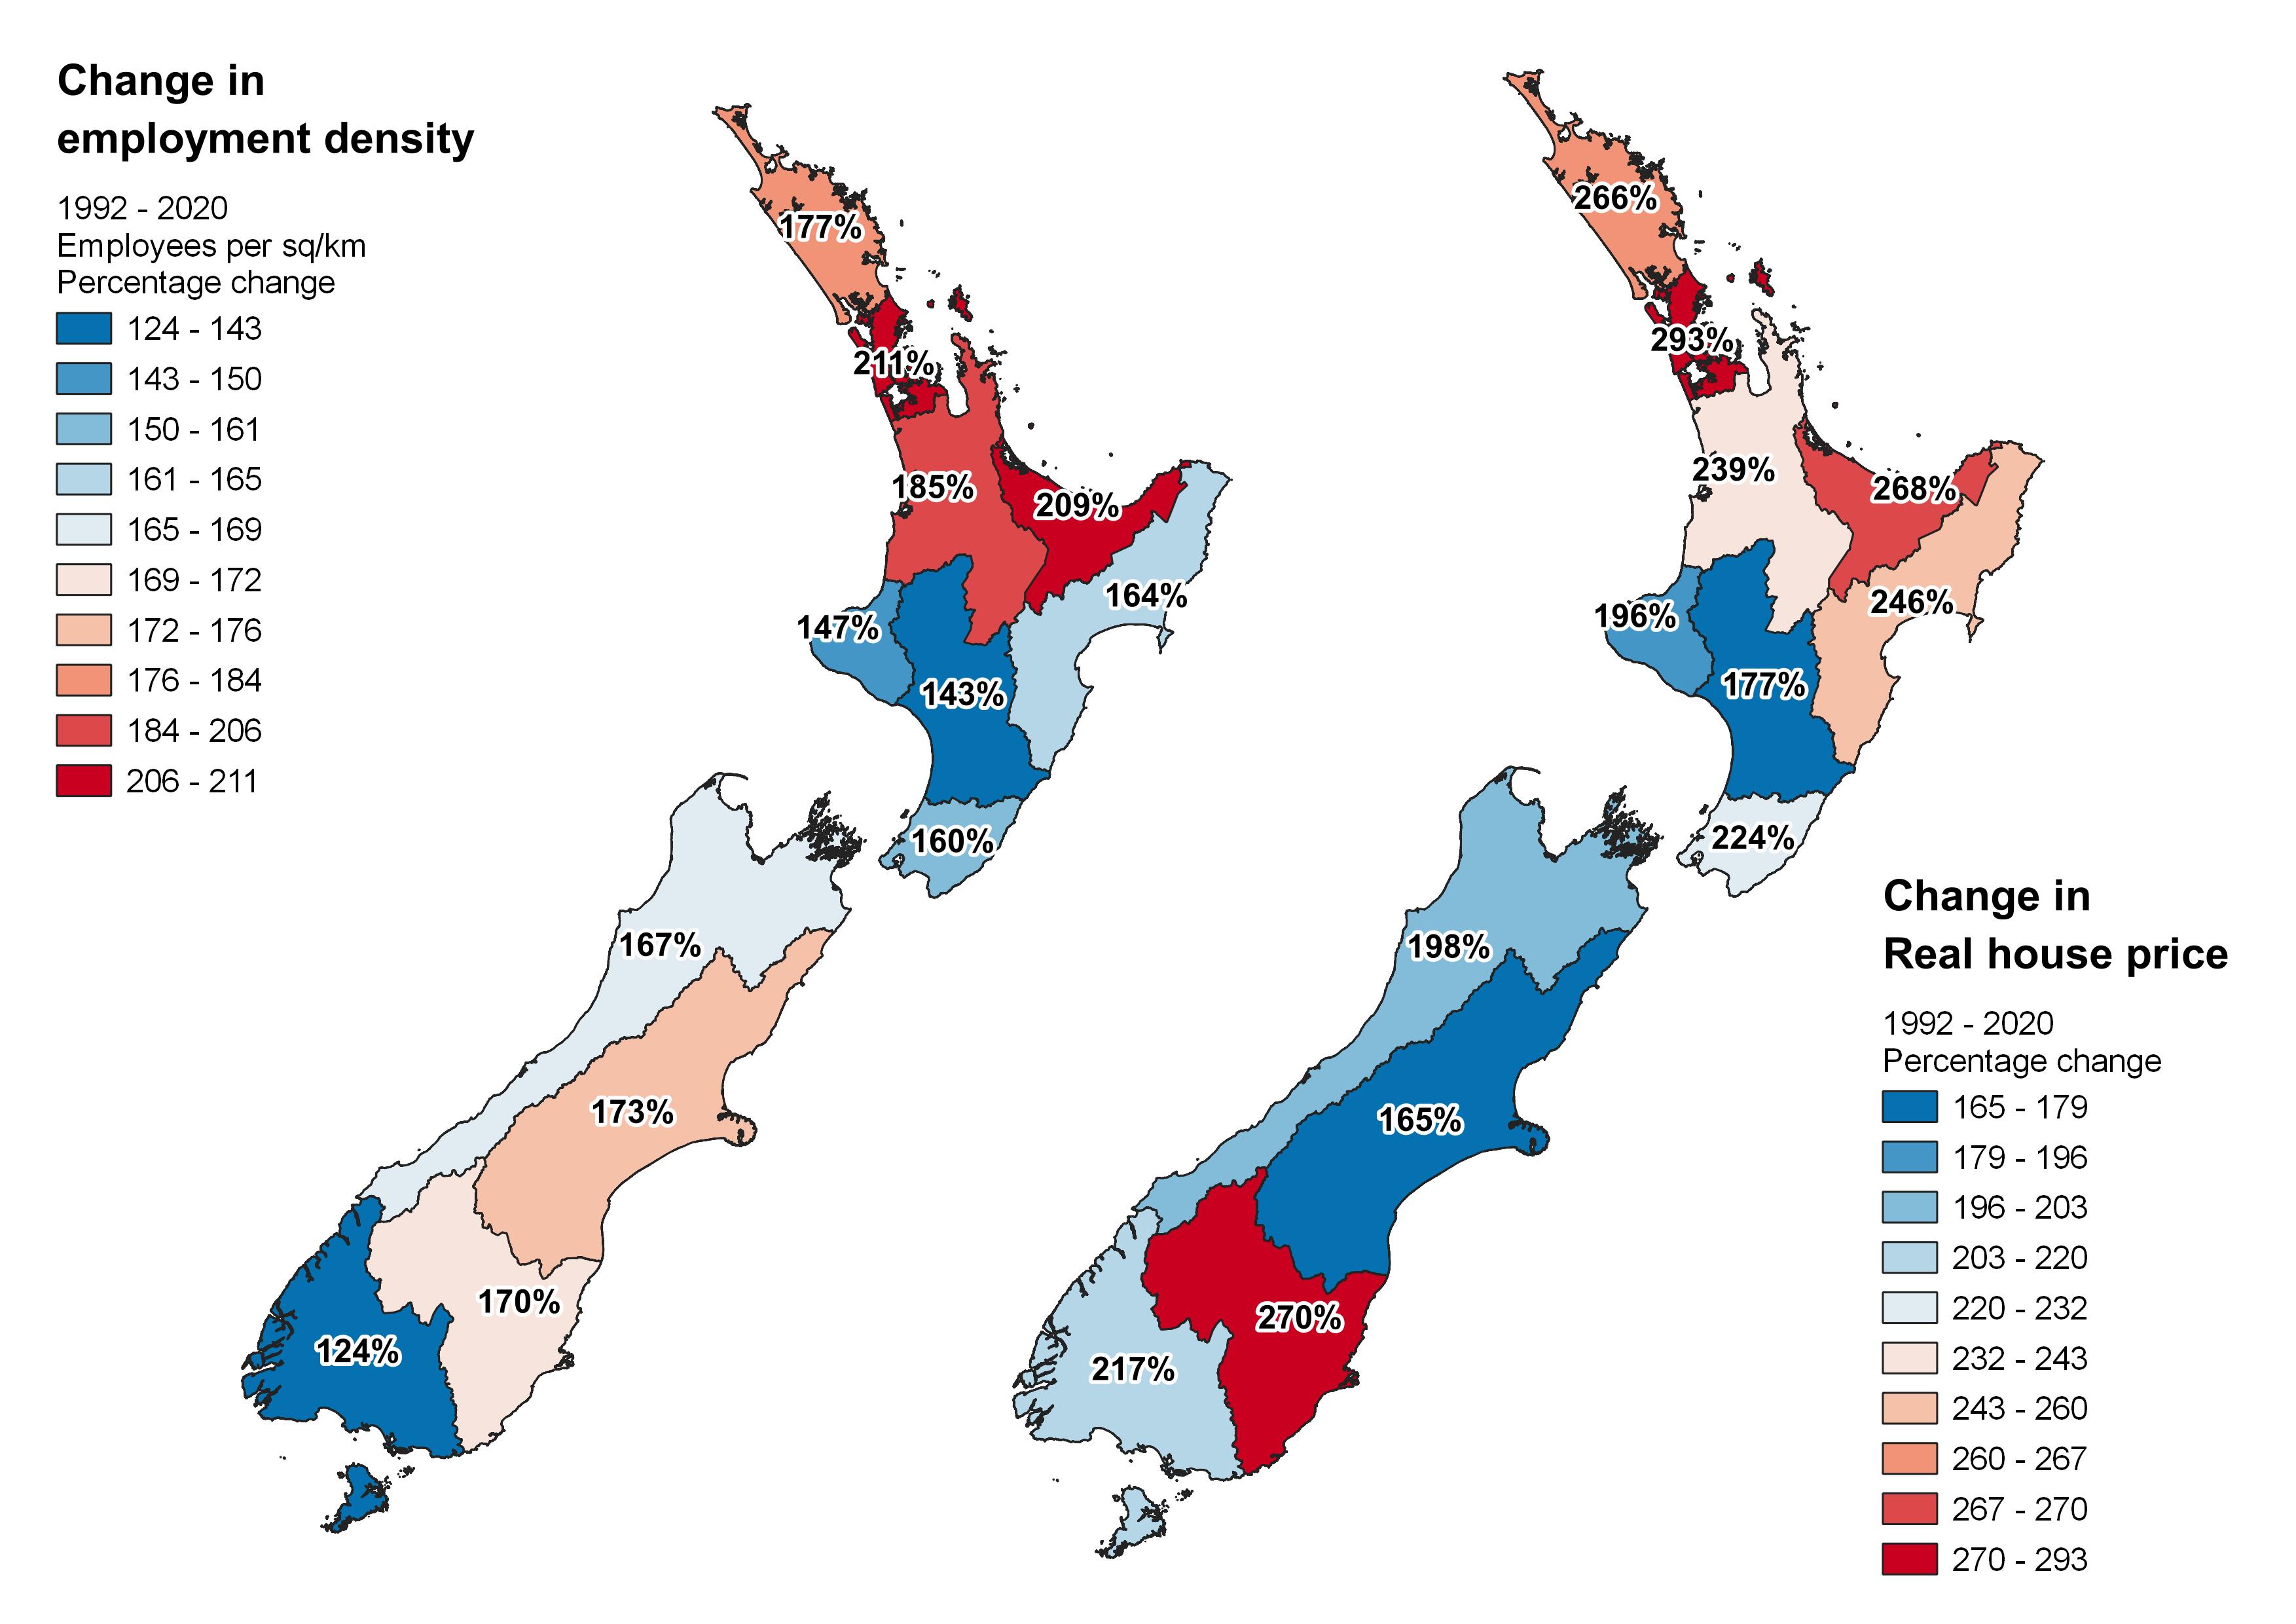
Source: REINZ, Statistics NZ, Principal Economics analysis.
Note: We use employment data from the Statistics NZ Household Labour Force survey and calculate the employment densities using regional land areas reported in Statistics NZ geographic boundaries files. We amalgamate areas to match those reported by REINZ for house prices to allow for comparisons. We source house prices from REINZ and deflate the reported data for inflation using the Statistics NZ CPI before calculating house price growth.
The population growth outpaced the housing supply
The supply of housing has not grown proportionately to the growth of population. Figure 9 shows that the numbers of new building consents across New Zealand have grown by 66 percent, while growth in population has been 75 percent over the 1971(Q1) – 2020(Q4) period. As will be discussed in section 3.4, the gap between demand and supply has further widened because of the decrease in the size of New Zealand households, which requires more dwellings to be supplied. We review the factors of this stringent housing supply in section 2.
Figure 9 Building consents and population growth

Source: Statistics NZ, Data 1850, Principal Economics analysis.
Note: We source our annual population data up to 2017 from Data 1850 and append additional years from Statistics NZ and determine the annual change. We use monthly new residential building consents data from Statistics NZ and aggregate by calendar year. We highlight notable recessionary periods in New Zealand identified by Reddell et al., (2008). These include the First Oil Price Shock (1974 – 1977), The Second Oil Price Shock (1979 – 1982), The 91 – 92 Recession, (attributable to the 1987 share market crash, subsequent monetary responses and impacts of the first Gulf War - 1991 – 1992), The Asian Crisis and drought (1997 – 1999), we add COVID-19 as an additional recessionary period (2020-).
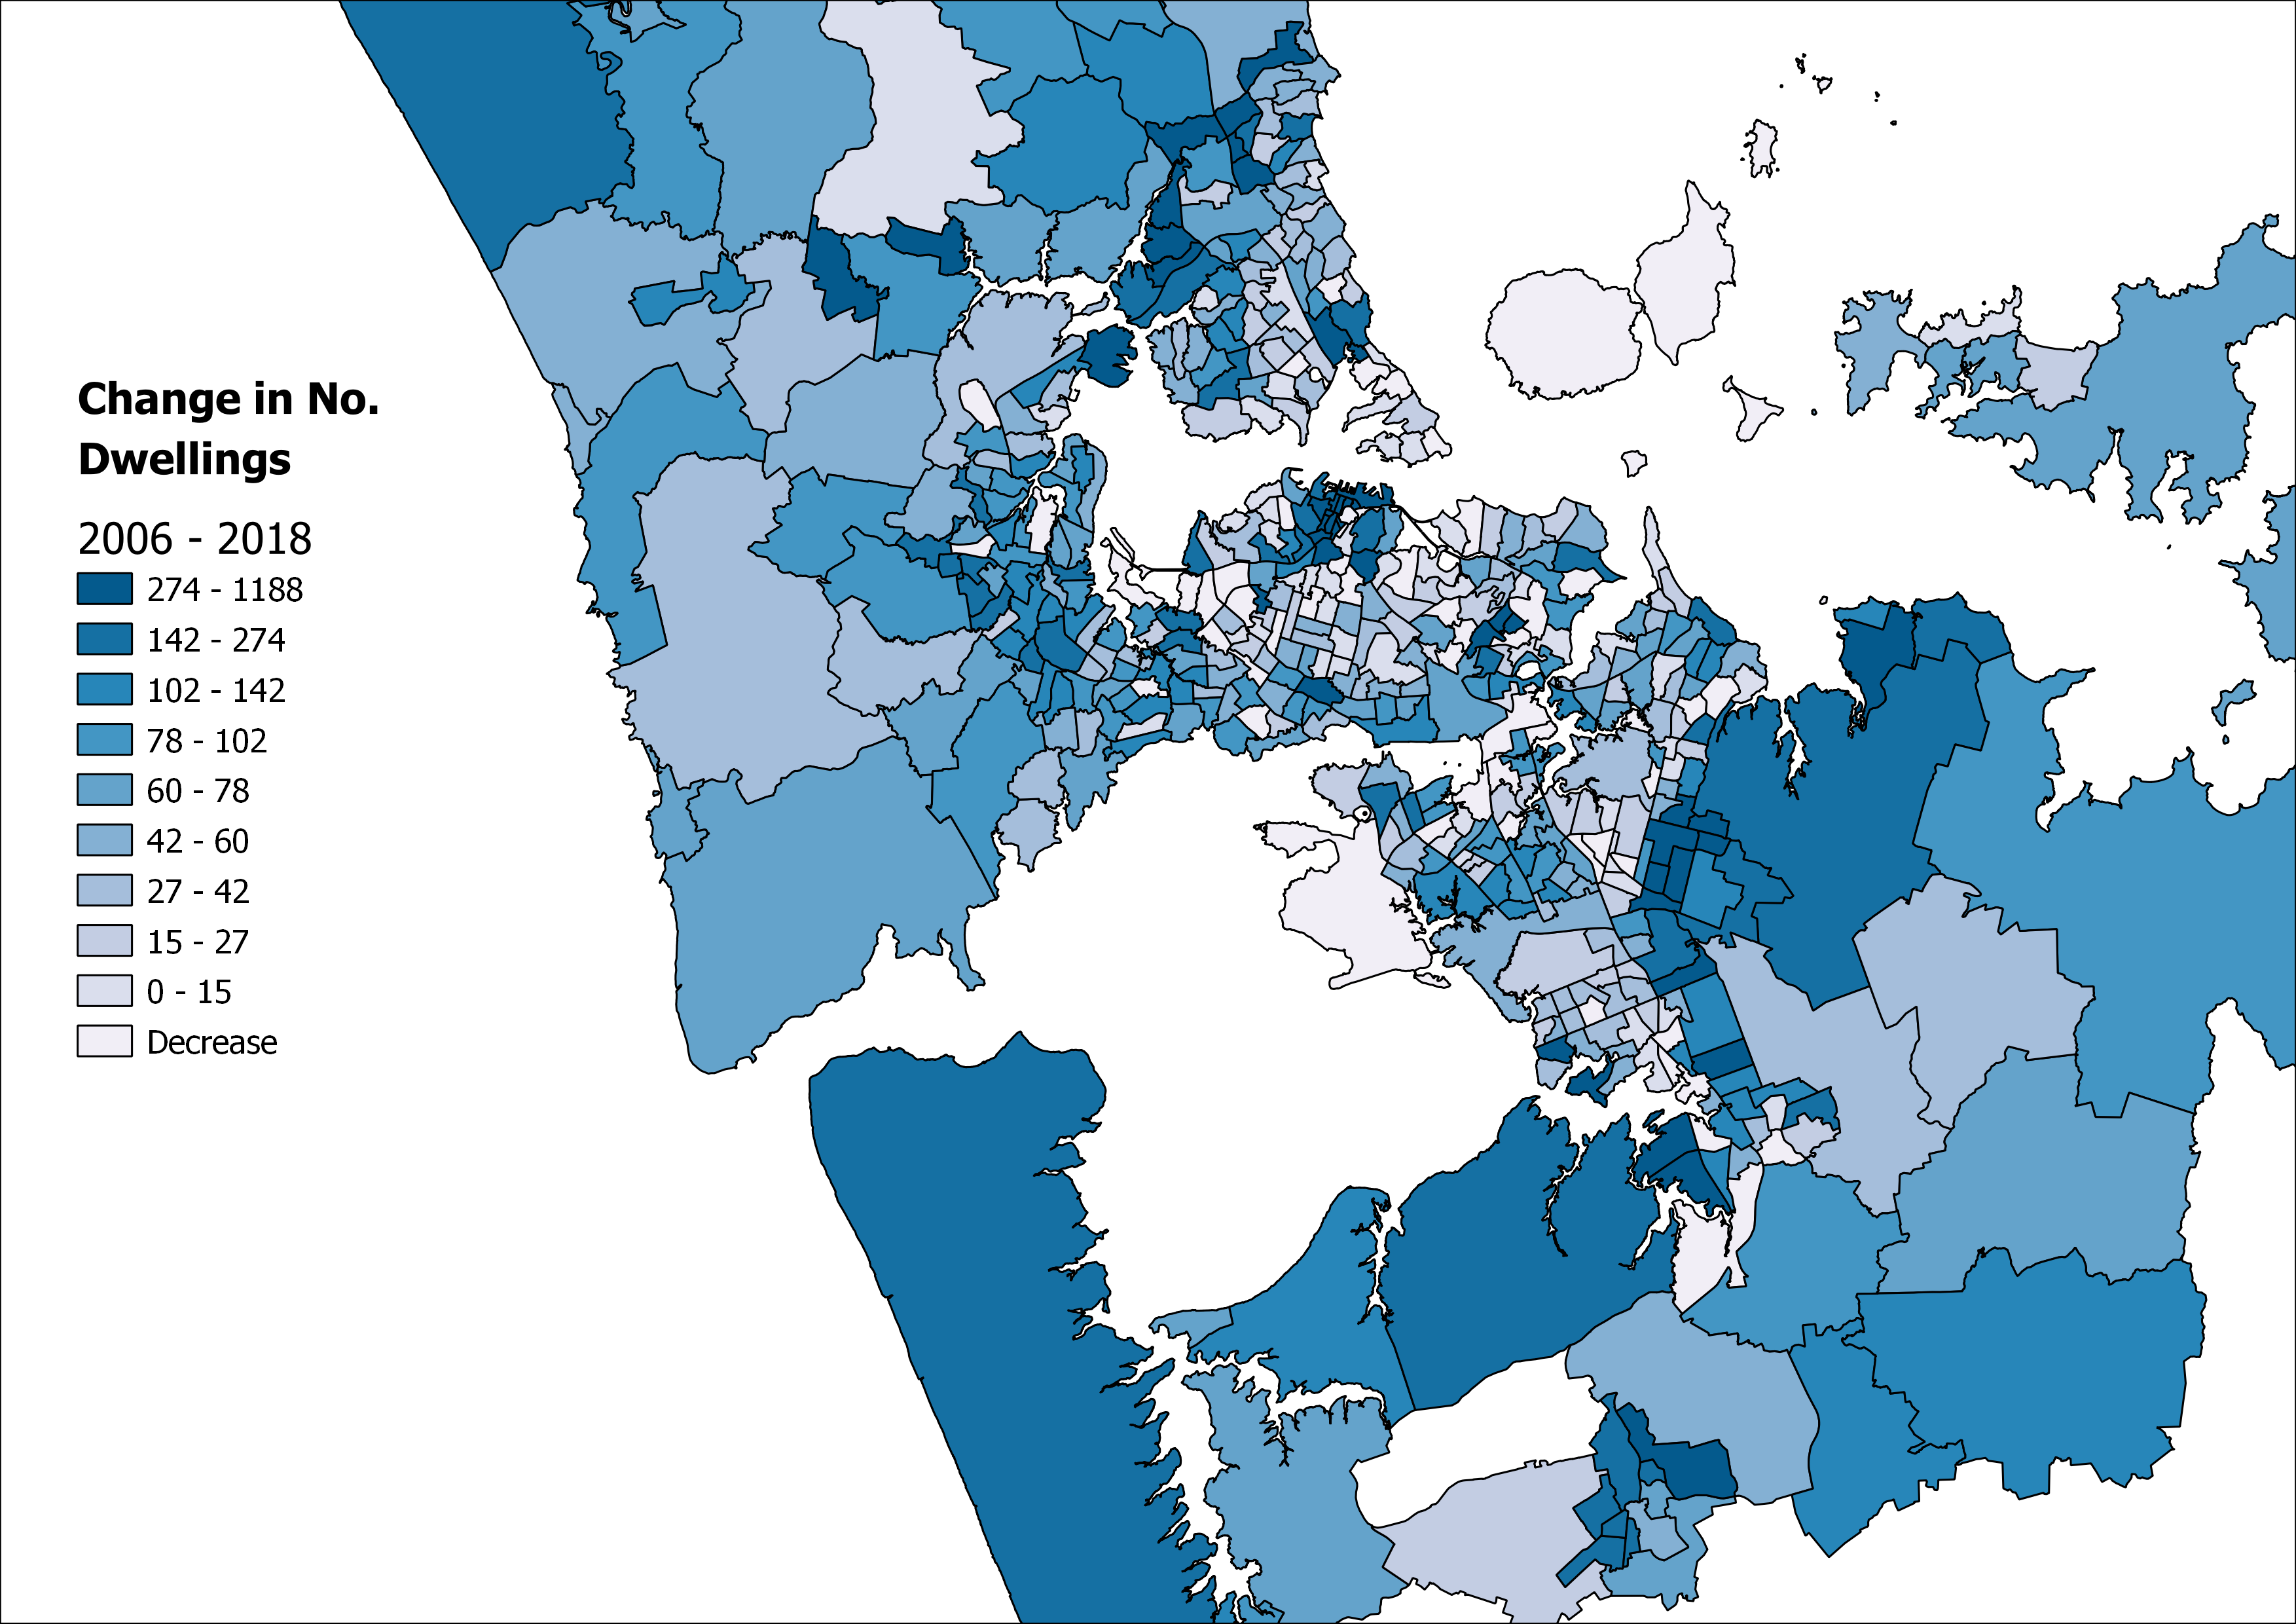
Planning regulations limited urban growth and led to a less responsive housing supply
In the absence of other costs, a higher HPG usually leads to increased incentives for the construction sector to supply more housing. However, the supply of housing has not been responsive to HPG in New Zealand - as will be discussed in Section 2. Using Auckland as an example, Figure 10 shows that growth in the number of dwellings has occurred mostly in the CBD and limited areas on the periphery of the city.9 This is an indication of the impact of regulation that has limited both brownfield and greenfield urban growth opportunities. (Cooper & Namit, 2021; Lees, 2017, 2019; Martin & Norman, 2020; Norman et al., 2021; Parker, 2021; Torshizian, 2016)
Investment in housing has grown at a faster rate than any other asset
Figure 11 shows the proportion of net capital stock (replacement value) across each asset type over the years of 1972-2019 with residential building increasing from 34 percent to 48 percent of total capital stock. Bassett et al. (2013) suggest this represents a “drag on New Zealand’s investment patterns” with investment in more productive sectors losing out to the housing market. We review the literature on the impact of the availability of finances in section 3.5.

The wide range of regulatory changes over the last century has constantly affected the housing market
Based on the literature, there has been a wide range of Acts, reforms and legislations that have affected the housing market in the last century. As shown in Figure 12, notable regulations including the RMA and the Building Act of 2004 follow earlier regulations in the housing market landscape. As will be discussed in our review of the literature, because of the inter-related impacts of these regulatory frameworks, our understanding of the impact of each regulation on HPG is limited.

1.3 HPG and housing affordability
The significant HPG has led to a lower housing affordability across all regions and most significantly in Auckland.
Simple measures such as the median-income house-price multiple shown in Figure 13 can provide an indicator for housing affordability. Accordingly, the median price to income multiplier in Auckland has increased from 7.5 in 2000 to 12 in 2020. While indicators tend to be blunt tools for describing affordability, an increase in the ratio of median house price to income from 6.02 to 9.74 for New Zealand is a significant sign of increasing housing affordability issues. We review housing affordability and its factors in section 3.1.
Figure 13 House price to household income median multiple10
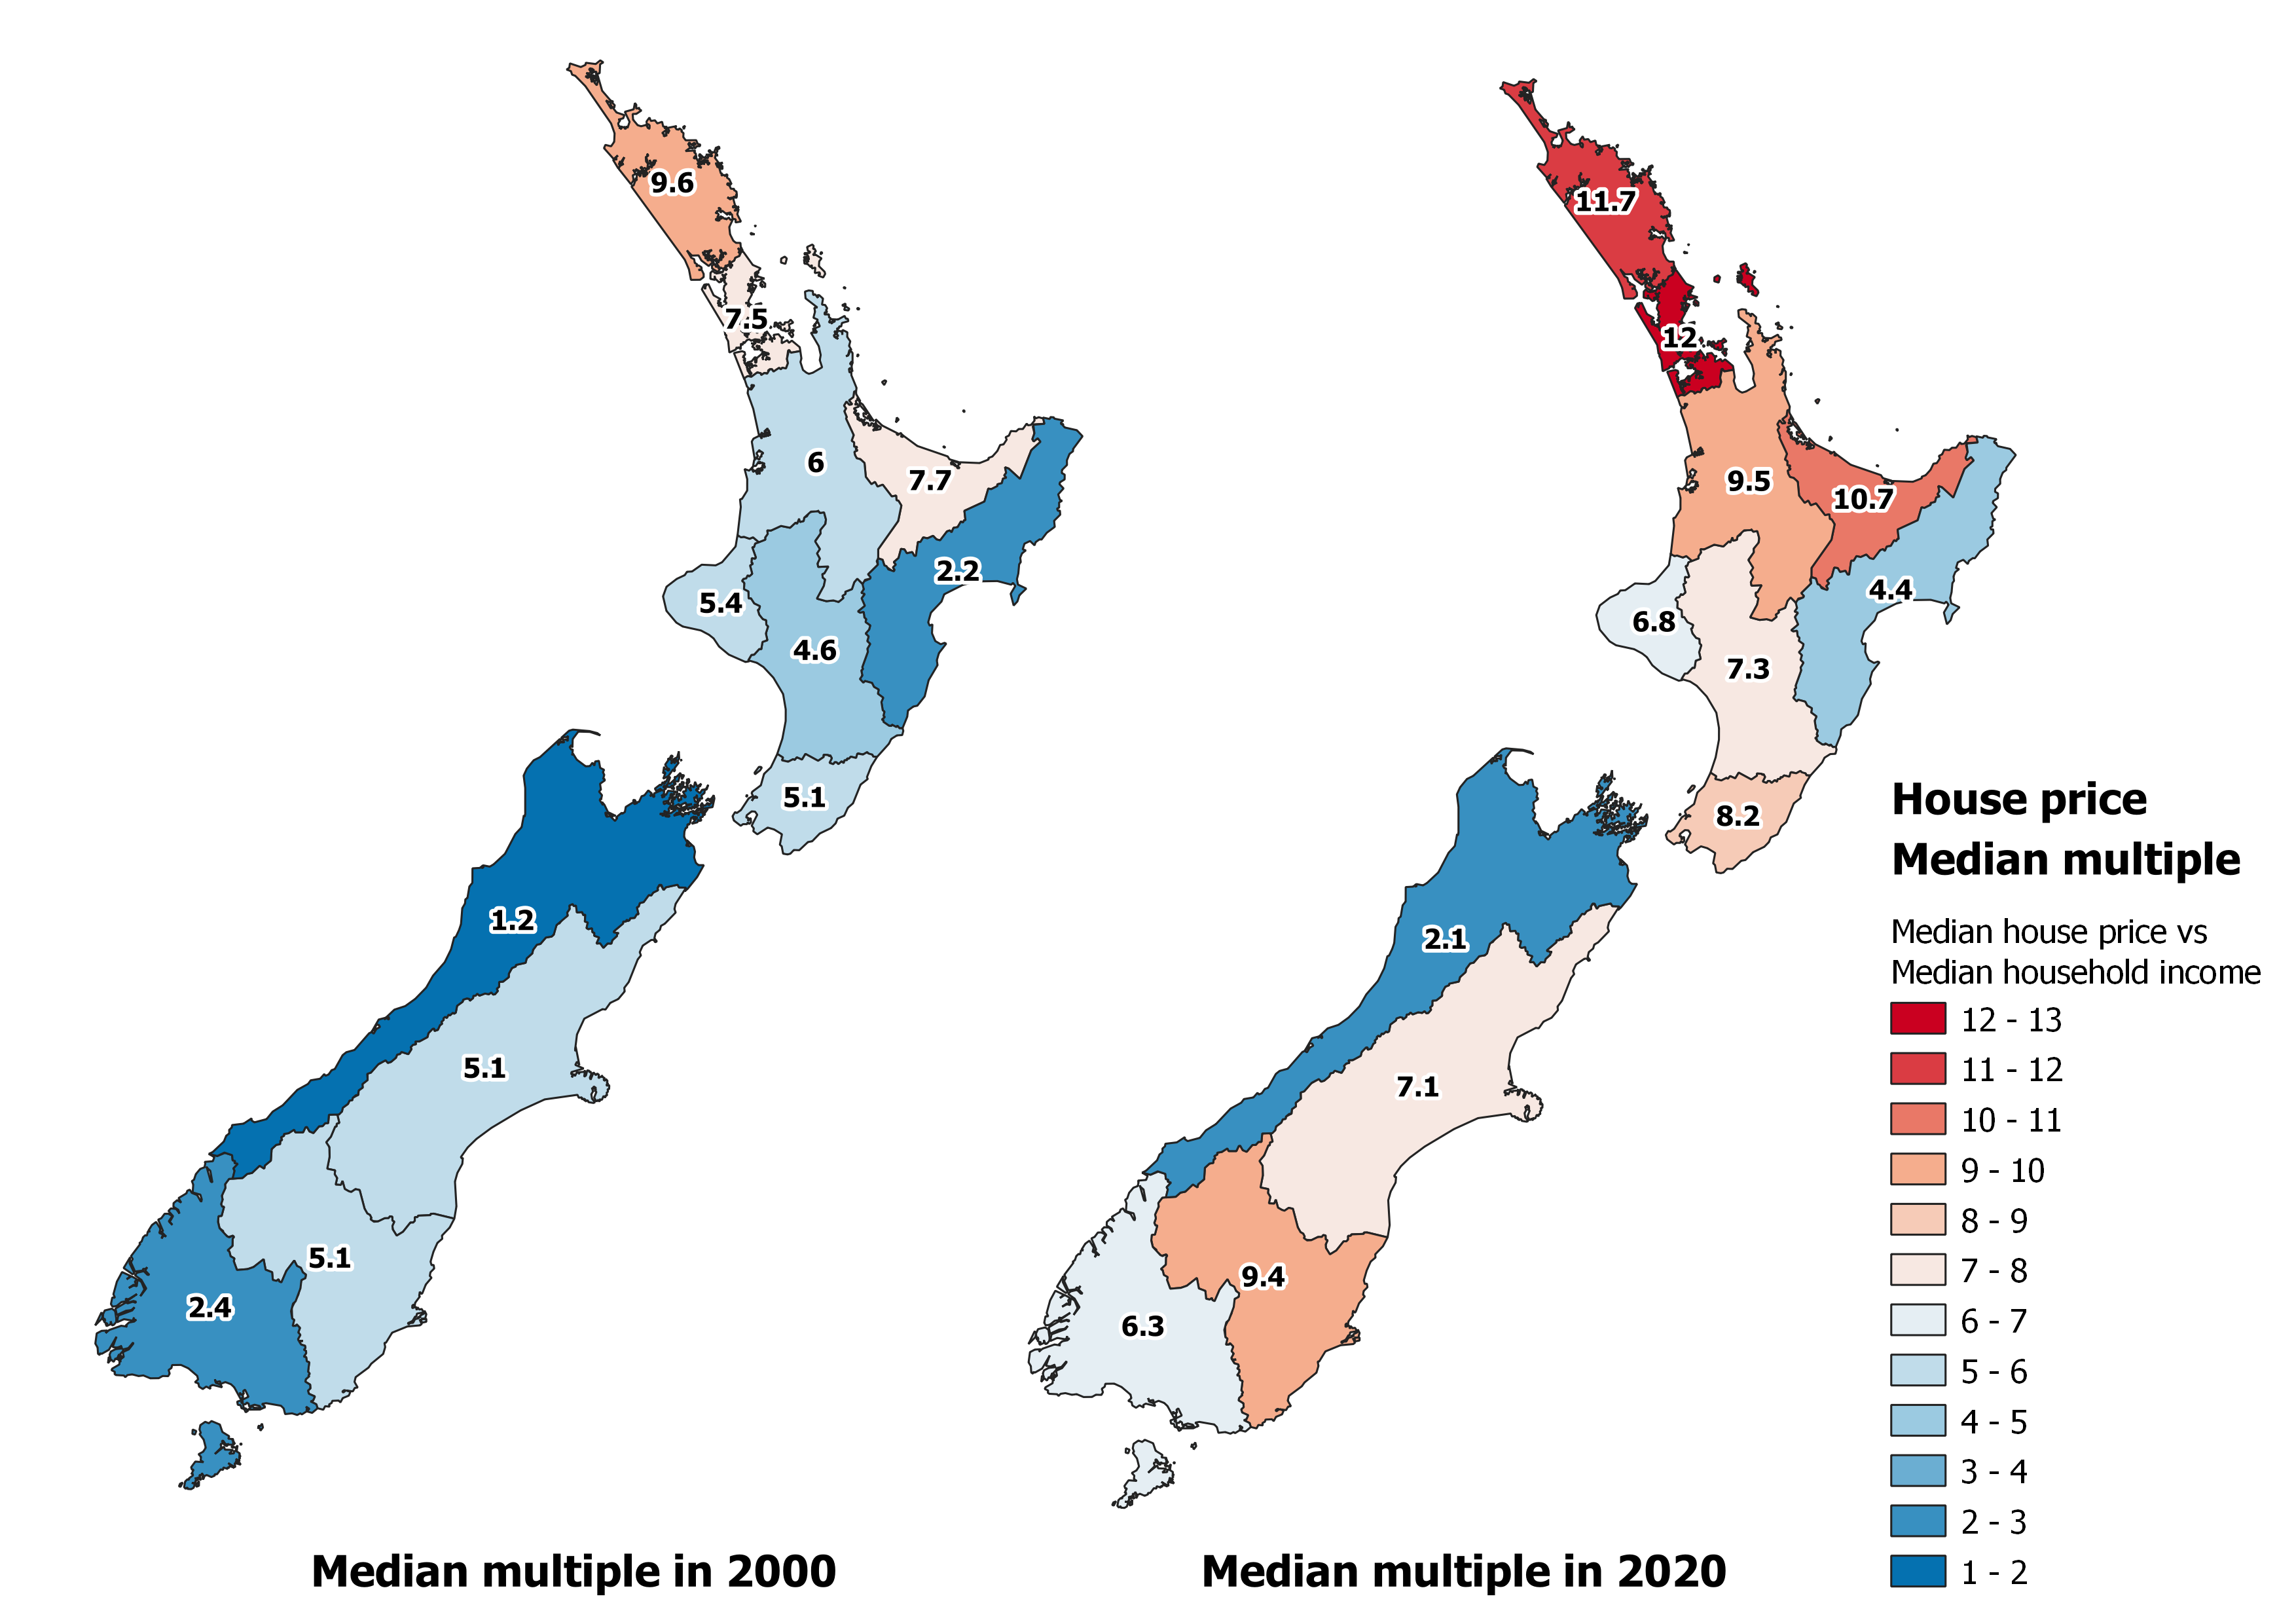
Source: REINZ, Statistics NZ, Principal Economics analysis.
Note: We source weekly household median wage and salary incomes from the Statistics NZ Household Labour force survey. Median house prices have been sourced the REINZ. In order to calculate the median multiple in each area and year we harmonize the datasets from REINZ and Statistics NZ by taking the average, median house price for the relevant years and areas (where areas are reported differently between sources) and calculate the stratified average household income based on household counts to determine household incomes. Our weekly estimates are then converted to annual based on a 52-week year.
The price that the median household income group could afford to pay has increased significantly over the last fifty years
The price that a household can afford to pay is a function of a range of factors, including changes in mortgage rates and household income.11 We used our housing affordability simulation model (ASIM) to show the changes in household affordability of the median household income group over the 1970-2020 period.12 As illustrated, there is a strong positive correlation between the amount that households can afford to pay and the median house price. While the mortgage rates have increased significantly up to 1986, the significant rise in income contributed to higher housing affordability levels. We review the relevant literature in sections 3.1 and 3.2.
Figure 14 Housing affordability/mortgage serviceability over time

Source: Statistics NZ, Bank for International Settlements, REINZ, RBNZ, Te Ara (years 1966 – 2008), Stroombergen, (2010), Principal Economics analysis.
Note:We estimate the Affordability Limit for the median households in New Zealandusing an adjusted multiplier (AM) which isthe maximum affordable loan to income ratio given the interest rate(i), the down-payment ratio (β), term of the loanandthe proportion of income a household allocates to mortgage payments(α). The formula we use for determining the adjusted multiplier is shown below.
\[AM = R \times \left( \frac{{1 - \left( 1 + i \right)}^{- N}}{i} \right),R = \frac{\propto}{1 - \beta}\]
We assume a down-payment ratio of 5%, 25-year loan term and 50% income to mortgage payment ratio across all periods to determine the Affordability limit shown in Figure 14. Median household incomes house prices have been sourced from Statistics NZ Household Labour force survey for the years of 1998 – 2020, which we backdate to 1970 using the average weekly income index. While this is an imperfect estimate given differences in household composition over time, it provides a reasonable long-run estimate of household incomes levels given the data available. We source historic variable first-mortgage housing rate (1966 – 2008) from Stroombergen, (2010) and append the residential mortgage floating interest rates from RBNZ, opting for RBNZ data for overlapping years. We rebase the real property price index sourced from The Bank of International Settlements to 1971. We highlight notable recessionary periods in New Zealand identified by Reddell et al., (2008). These include the First Oil Price Shock (1974 – 1977), The Second Oil Price Shock (1979 – 1982), The 91 – 92 Recession, (attributable to the 1987 share market crash, subsequent monetary responses and impacts of the first Gulf War - 1991 – 1992), The Asian Crisis and drought (1997 – 1999), we add COVID-19 as an additional recessionary period (2020-).
The gap between affordability levels of the highest and lowest income groups has widened
Figure 15 shows the price that each household income group can afford to pay for purchasing a house. We have assumed that the proportion of income allocated for homeownership is fixed at 50 percent. Accordingly, the affordability for higher income deciles has increased at a faster rate over the years of 2007 – 2019. Affordability limits for the decile 9 household income group has increased by 23 percentage points higher than decile 1.
Figure 15 Housing affordability/mortgage serviceability at different income levels

Source: Statistics NZ, RBNZ, Principal Economics analysis.
Note: We estimate the affordability limits by year and income decile as categorised in the Statistics NZ Household Economic Survey. Affordability limits are determined using the formula noted in Figure 14 using the upper income limits for each decile group and the 2-year fixed mortgage interest rate.
The high HPG, increased affordability limits and higher rental prices relative to mortgage payments have led to lower homeownership over the last two decades
As shown in Figure 16, in 1971, 64.5 percent of households owned their own home, with this proportion peaking in 1991 at 73.8 percent. Home ownership has since gradually declined to 64.5 percent in 2018. The year 1991 is significant as it has marked the end of the home-ownership support programmes and the start of a significant sell-off of state housing in New Zealand (Johnson et al., 2018). Over the period 1991 – 1999, state housing stock decreased by 8,900 units or 13 percent of the total state housing stock (Schrader, 2012).

These methods include random assignment designs, regression discontinuity designs, panel data with fixed effects, and difference in differences methods↩︎
For a high-level discussion on the inter-related impact of the factors of housing see Grimes (2015). ↩︎
We index the seasonally adjusted rental prices and house prices and the CPI to the initial starting period to determine the magnitude of change over the last fifty years. We have sourced the historical data for index from Bank for International Settlements who in turn sourced this information from RBNZ (and in turn from Quotable Value Limited, as the Core Logic House Price Index previously known as the QV House Price Index). We have not directly sourced this information from RBNZ as at the time of writing this report, this information is not provided publicly on the RBNZ website. Details on the methodology used to determine the series can be found at https://www.rbnz.govt.nz/statistics/key-graphs/qv-quarterly-house-price-index.↩︎
While the current descriptive statistics do not provide a benchmark for comparisons of the house price growth, consistent with previous studies, we use rent price growth and changes in consumer price index (CPI) as our benchmark over time. We acknowledge that house prices represent a stock of wealth (capital), while rents represent a flow, a payment for using the capital. In the literature, the comparisons between (growth rates of) house prices and rents has been used as a measure of housing affordability.↩︎
Squires et al. (2021) studied the relationship between rental and house prices in New Zealand. Their results suggest that house price (affordability) leads to rental price (affordability) with a lag of half a year.↩︎
While house prices represent a stock of wealth (capital), rents represent a flow, a payment for using the capital.↩︎
Since this figure does not account for land area, the increases in some larger suburbs, should not be misinterpreted as high growth↩︎
We use data from REINZ for median house price by region and median household incomes from Statistics NZ Household Labour Force Survey↩︎
Our housing affordability simulation model also accounts for likely wealth levels and the loan to value ratio. However, since our information on wealth does not go back to 1970s, we have excluded wealth levels from the affordability limit illustrated in this figure↩︎
For details on ASIM see https://www.principaleconomics.com/models/asim/↩︎